Welcome to J's Weather Map Of The Week Page. What you will find
here is a weather map (chart, satellite map, plot, whatever) of an event
that occurred sometime during the last week. The Weather Map Of The Week
is an exceptional or extreme diagram that I happen to come across while
surfing for weather data. This page is usually updated on weekends,
though it could change at any time.
This Week's Map
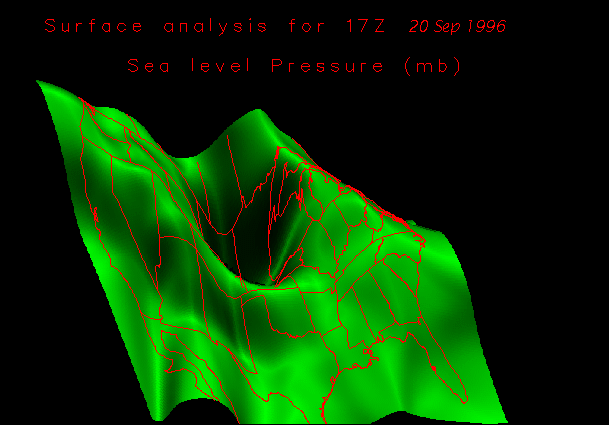
Strong Occluded Low over Midwest US
Fri, Sep 20, 1996, ~17:00 GMT
3-D US Pressure
58K GIF Enhanced* SourceLocation
NOTE: Enhanced* = Enhanced (Not Altered) by J for Clarity
NOTE: Source = Where I got discovered the Location
NOTE: Location = Where the image was located
This page was created 6/29/96 by J.
Ferrell
This page last modified 9/22/96 by J.
Ferrell
Wx Map of the Week Pages Served Non-Locally Over
Times Total Since It's Inception