
Welcome to the CASI Weather Map Of The Week Page. What you will find here is a weather map (chart, satellite map, plot, whatever) of an event that occurred recently (the weather doesn't work on a weekly timetable so it may not actually be a week). The Weather Map Of The Week is an exceptional or extreme diagram that I happen to come across while surfing for weather data. This page is usually updated on weekends, though it could change at any time. Click on the map for the full sized version.
This Week's Map
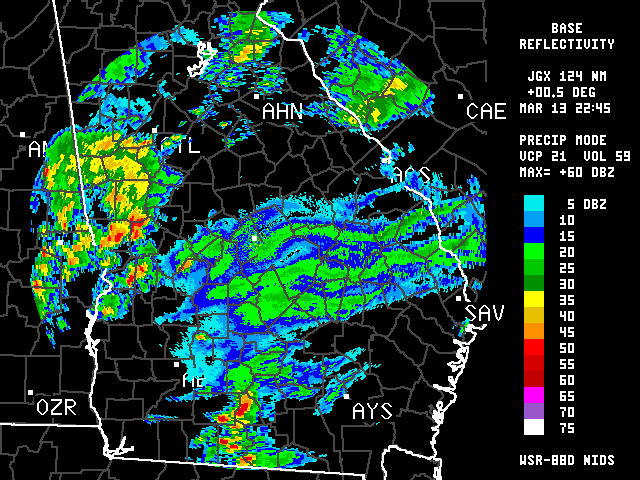
Strange Radar Over Georgia
Event: Hot (>60dB) Cells and Wavy Precip
Lines in Georgia
Date: March 13, 1997 5:45 PM
Type: IR Satellite Enhanced
Format: 46K GIF
