Current Weather At CASI HQ: Click Here For More Info |

| MAIN | STORM REPORTS | US SEVERE | MEMBERS | JOIN CASI | HELP/CONTACT | CAM |
|
Central |
|
|||||||
| Atlantic | |||||||||
| Storm | |||||||||
| I
n v e s t i g a t o r s |
|||||||||
|
|||||||||
|
Carolina
Storm System |
|
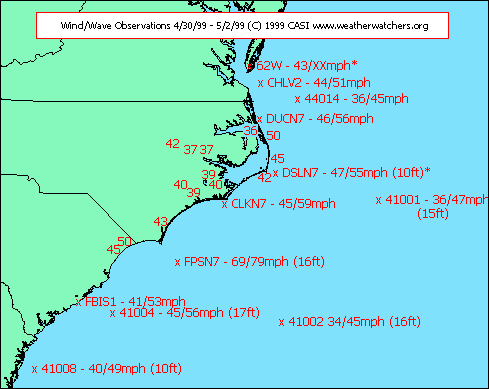
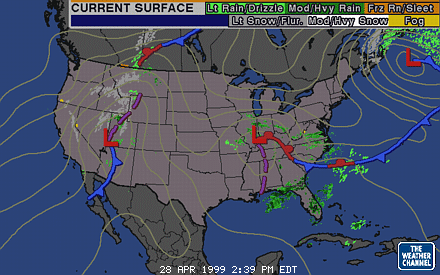
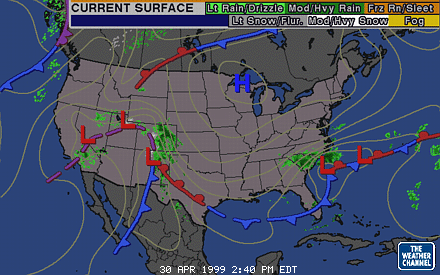
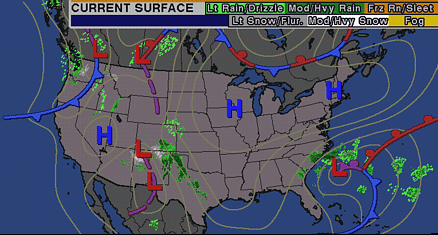
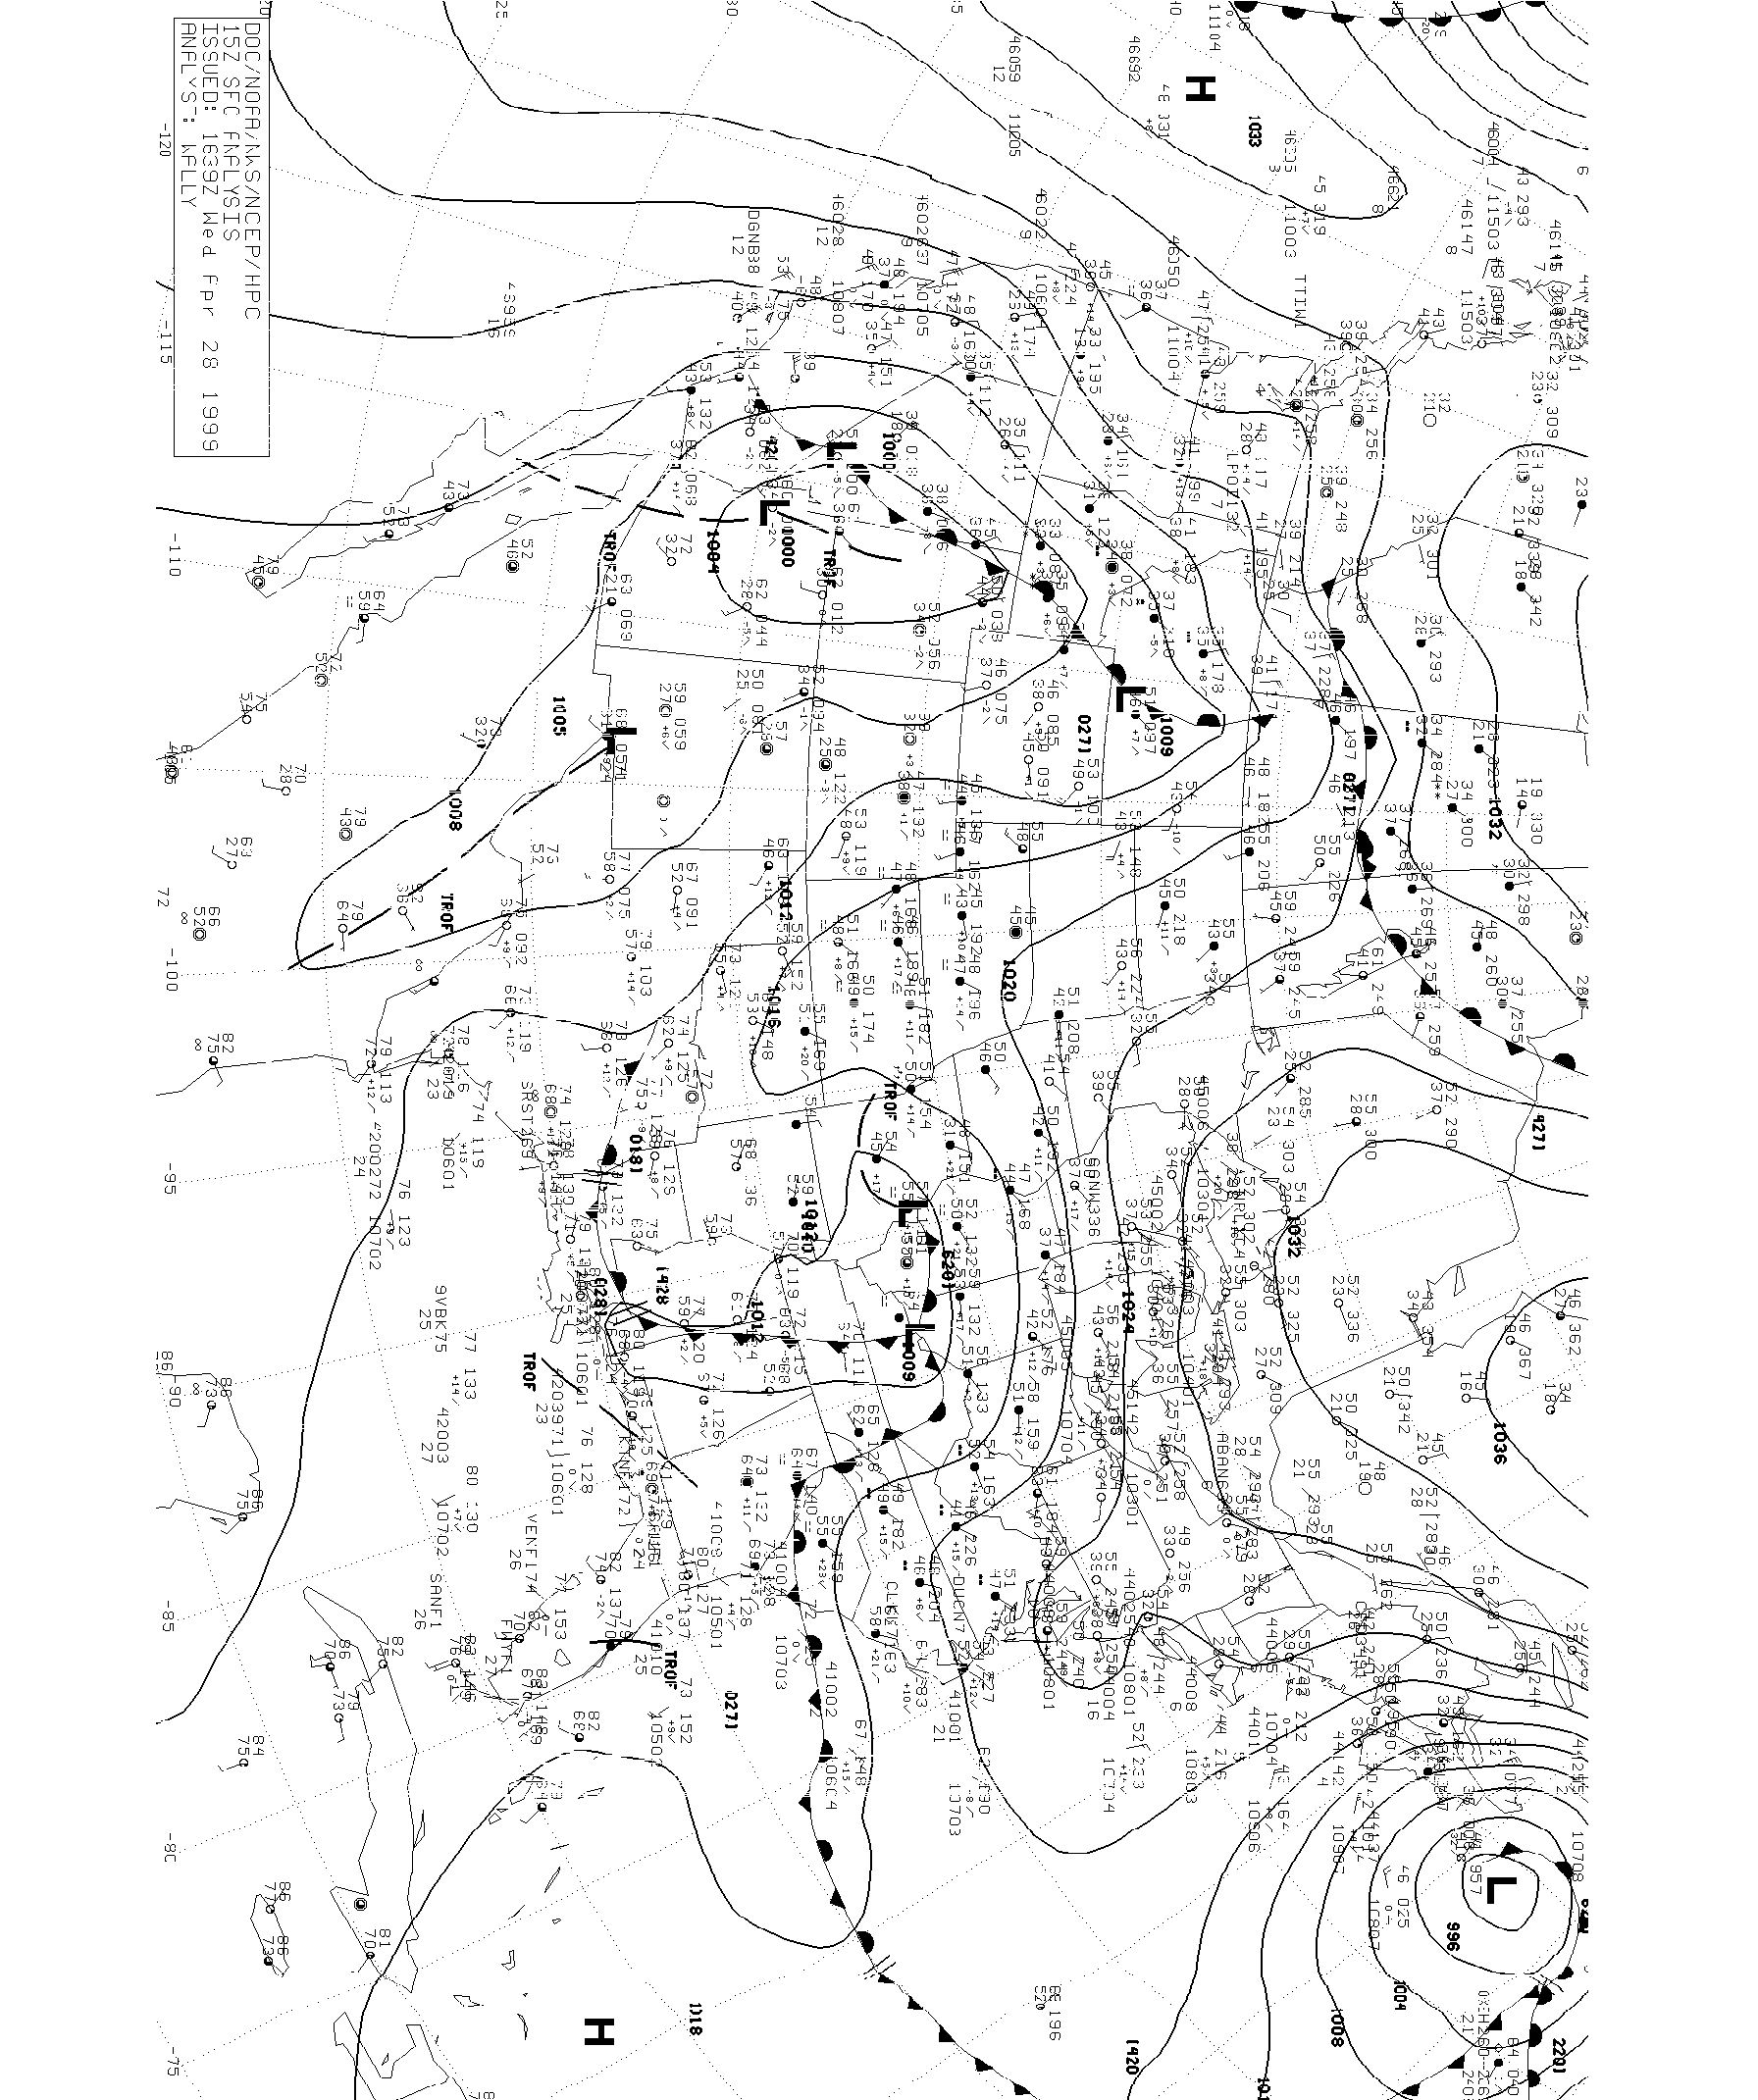
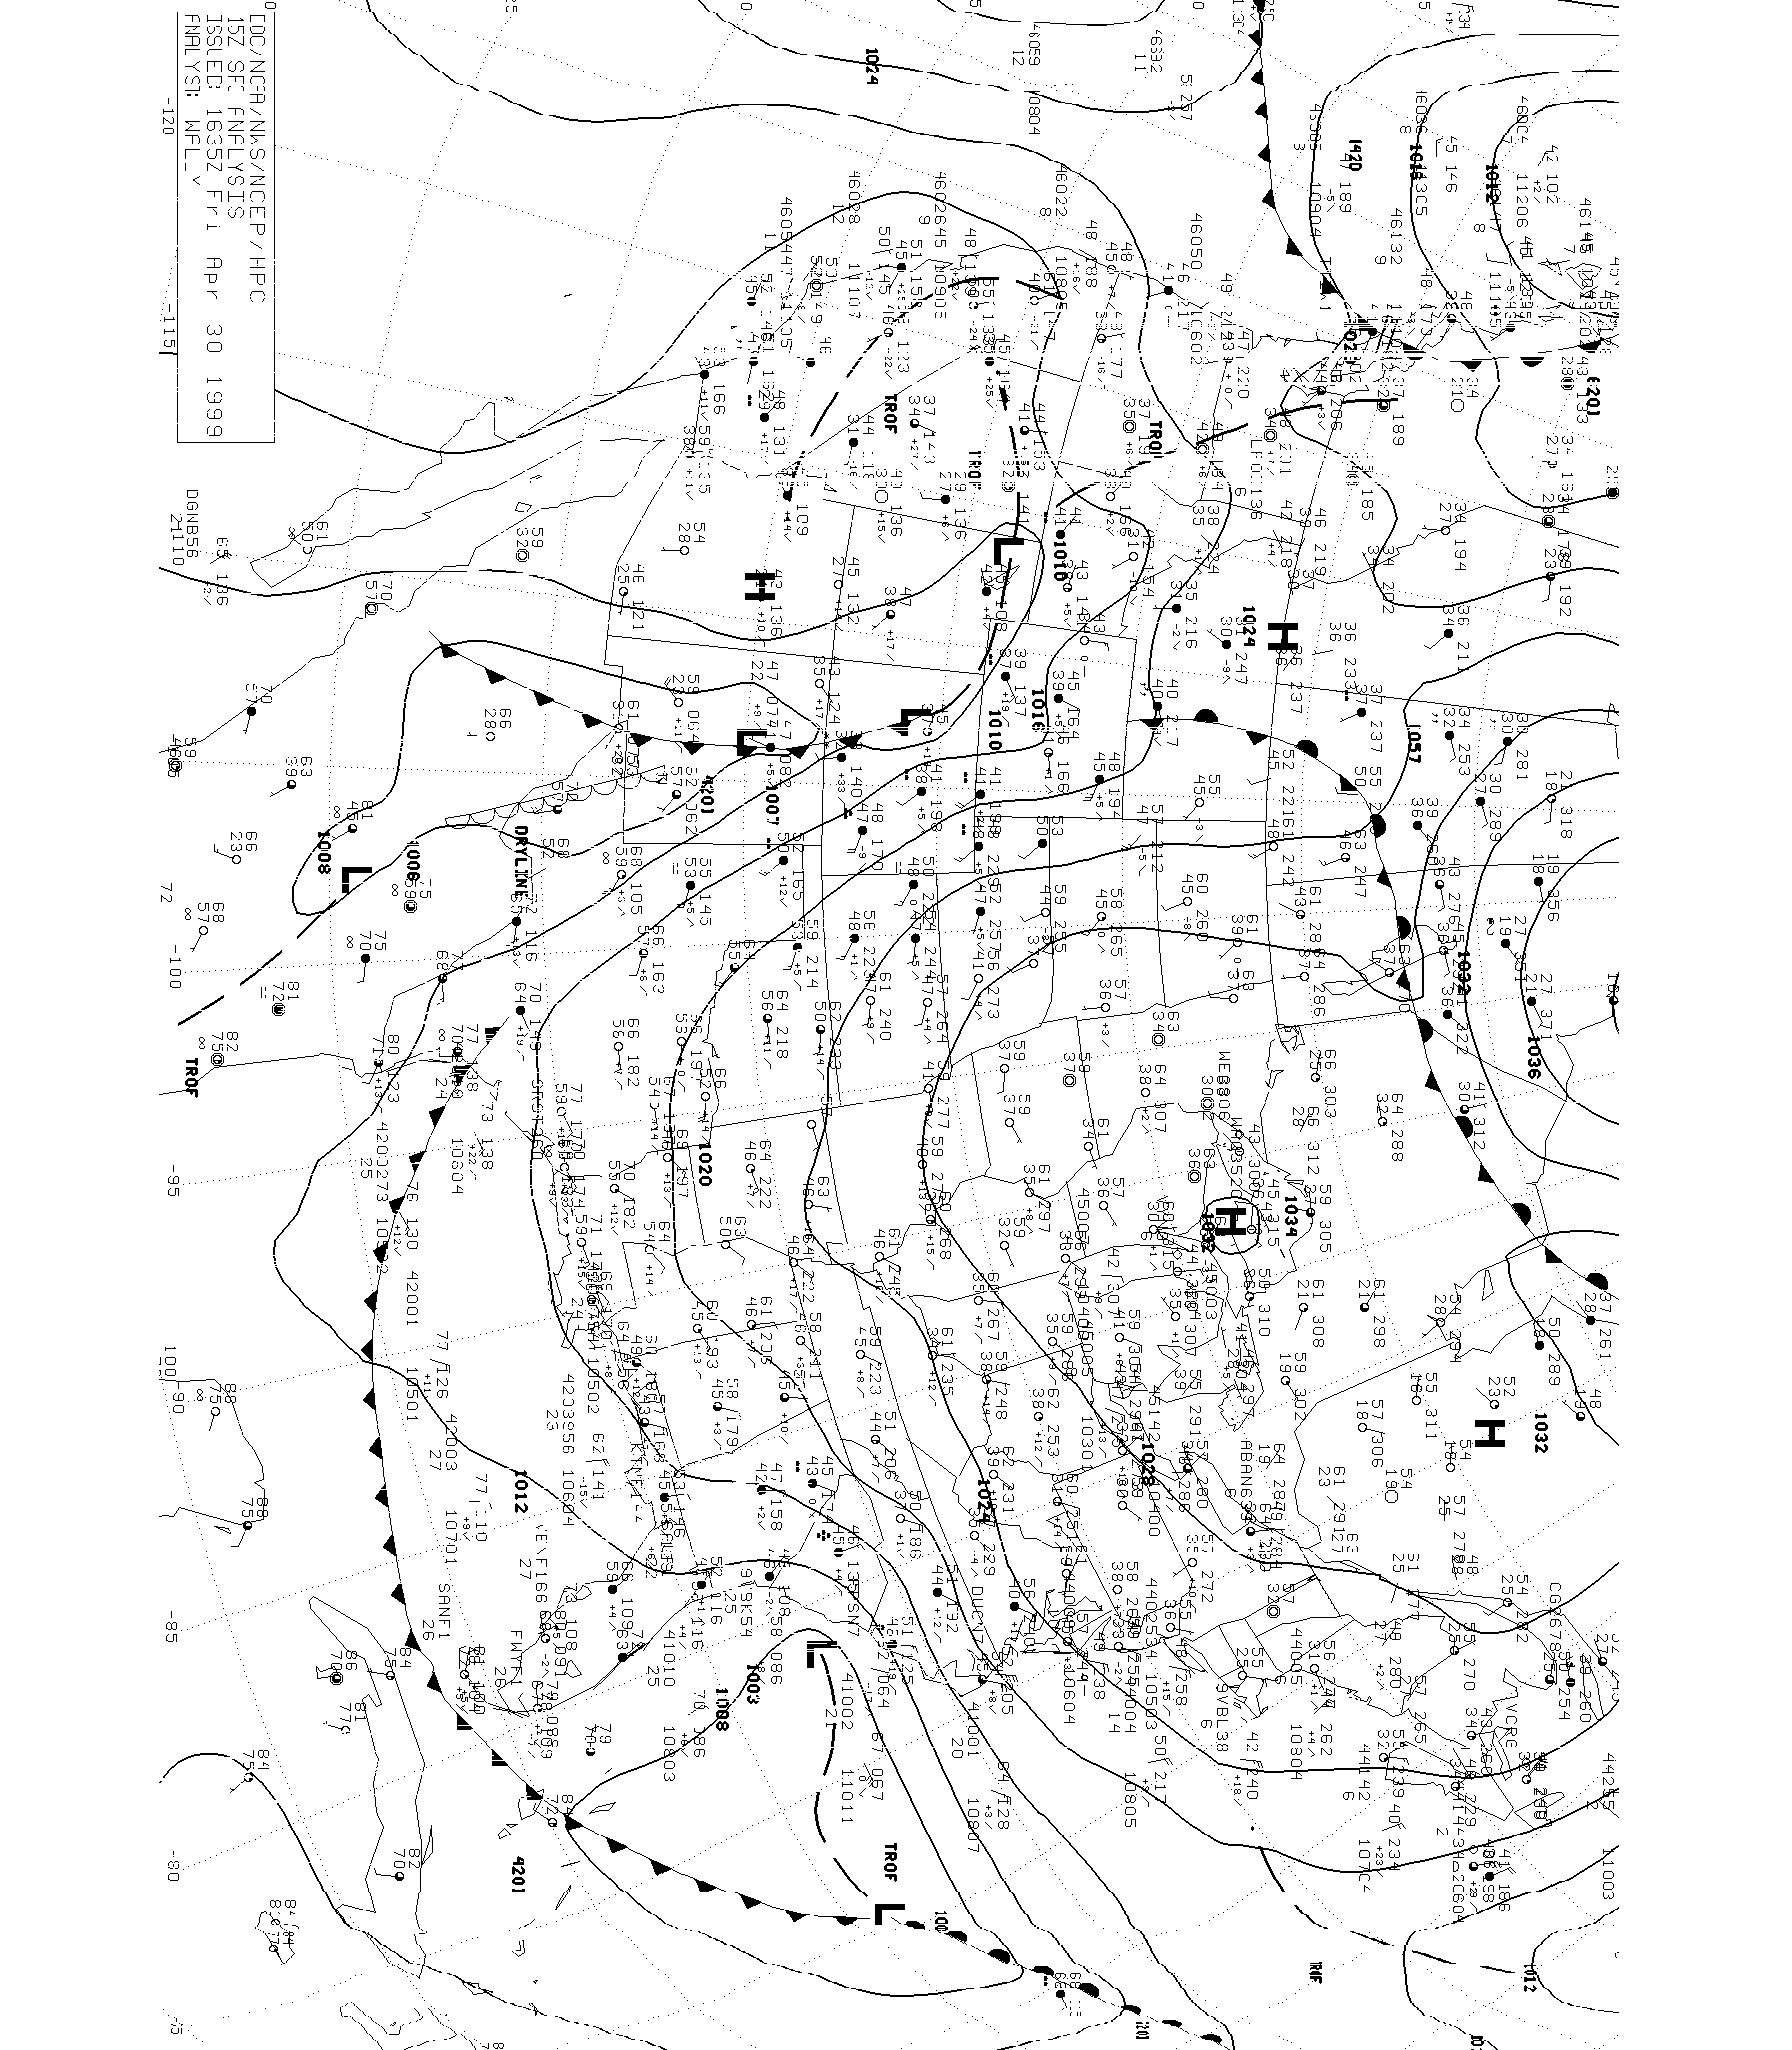
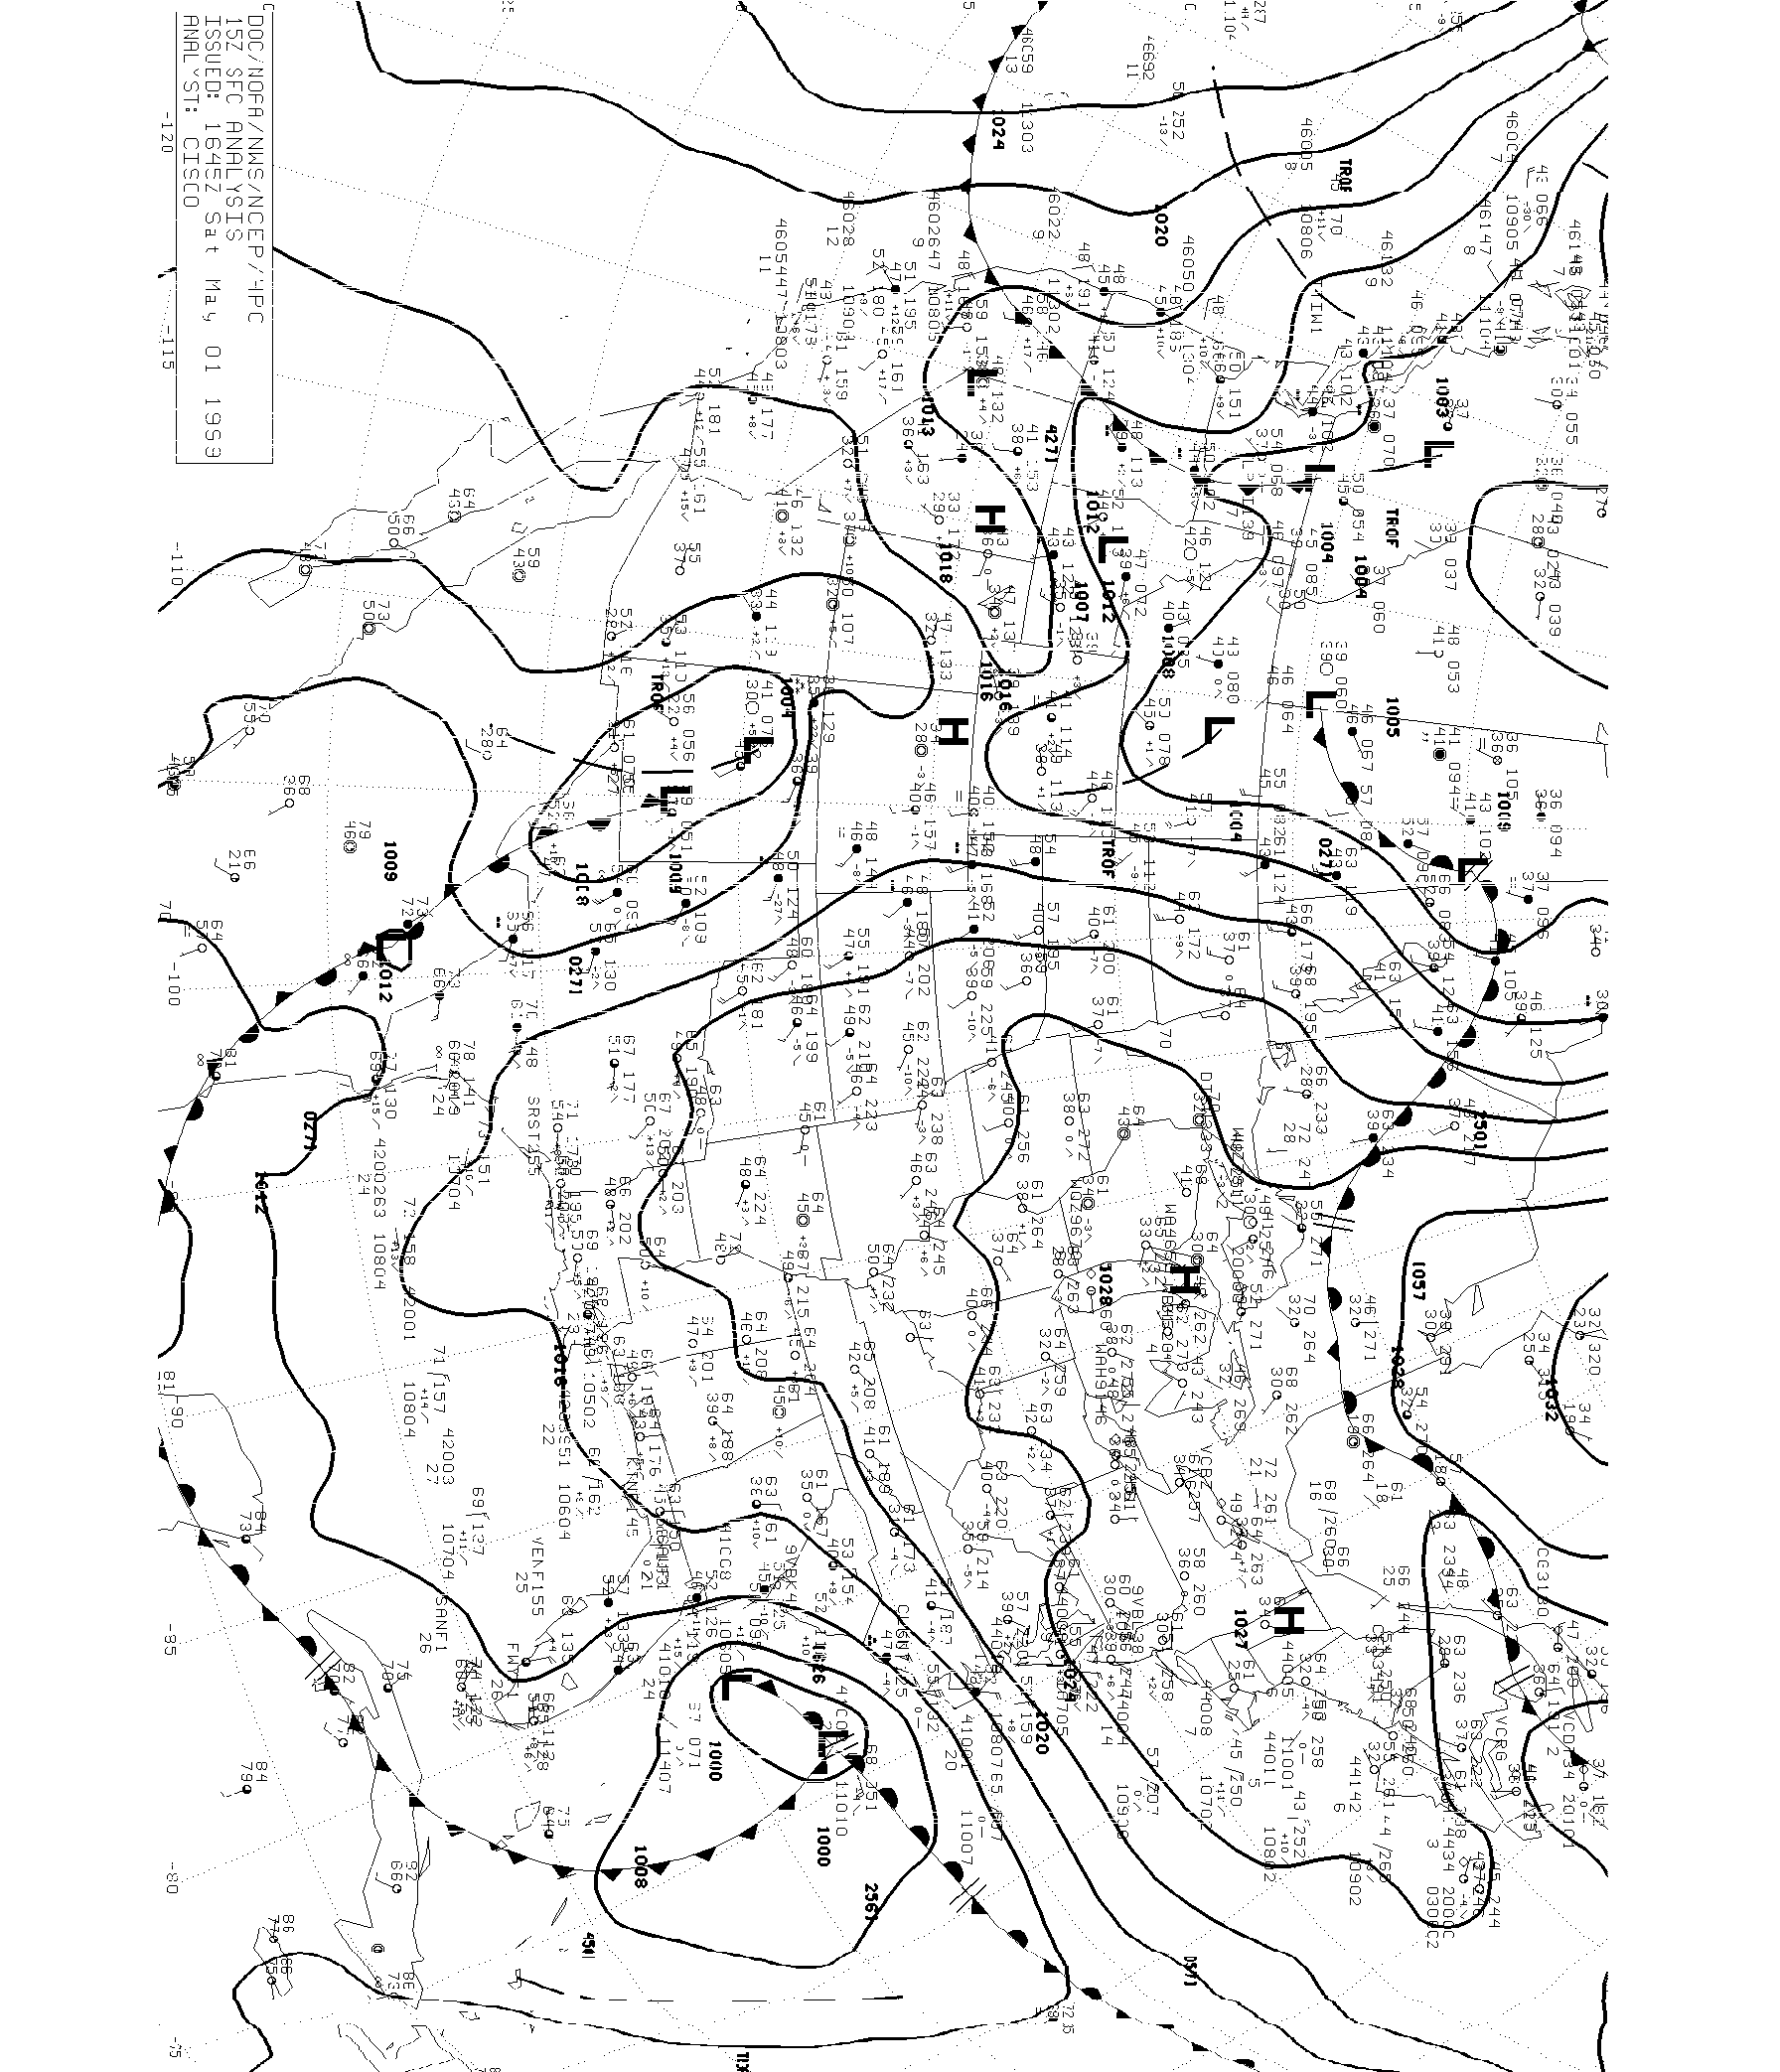
A low pressure system developed off the coast of the Carolinas on April 29, 1999 and stayed there for several days, causing tropical storm-force conditions over the coastal areas. Winds gusted to 79mph off the coast at Frying Pan Shoals Tower, NC, and waves of 17 feet were observed from buoy 41004 off the coast of South Carolina. Over 13" of rain fell near Wilmington N from 4/27 to 4/30. Over 21" of rain was observed off the coast of NC from 4/27 12pm to 5/1 at 12pm (more fell afterwards).* Forecasts from the NWS on 5/1 looked like this: NWS-ILM (Wilmington) ...STORM WARNING... ...COASTAL FLOOD WATCH... ...HEAVY SURF ADVISORY... .THIS AFTERNOON...NE WIND 45 TO 50 KT AND GUSTY. SEAS 11 TO 13 FTBUILDING TO 14 TO 17 FT. WIDESPREAD RAIN AND TSTMS BECOMING SCATTEREDLATE. .TONIGHT... NE WIND 30 TO 35 KT BECOMING N. SEAS SUBSIDING TO 9 TO12 FT. AREAS OF RAIN AND TSTMS. HATTERAS TO 30N ...STORM WARNING... ...N WALL OF GULF STREAM 31N 80W...32N 79.4W...32.3N 77.8W...34N 76.6W... 35N 75.3W... .TODAY...NE WINDS 35 TO 50 KT N OF CAPE ROMAIN AND NW 20 TO 30 KT S OF CAPE ROMAIN BECOMING N TO NE 35 TO 50 KT THROUGHOUT. SEAS 12 TO 18 FT N OF CAPE ROMAIN AND 6 TO 12 FT S OF CAPE ROMAIN BECOMING 12 TO 22 FT THROUGHOUT. WINDS LOCALLY TO 60 KT SEAS TO 27 FT NEAR THE GULF STREAM. NUMEROUS SHOWERS AND TSTMS OVER N PORTION SPREADING THROUGHOUT. .TONIGHT...NE WINDS 35 TO 50 KT EXCEPT TO 60 KT NEAR GULF STREAM. SEAS BUILDING TO 14 TO 24 FT EXCEPT TO 30 FT NEAR GULF STREAM. NUMEROUS SHOWERS AND TSTMS. Additional Information and Graphics:
* = The above observations were taken from the following data. Rounding errors could have occurred while converting winds between units.
|
© 1999 Central Atlantic Storm Investigators |